Honeypots 103: Decoding Your SANS DShield Honeypot’s Data
A Beginner’s Guide to Analyzing and Making Sense of Your SANS DShield Honeypot Data Captures
Greetings, Cyber Mavericks!
Welcome to the next instalment in the “Honeypots” series. If you’ve been following along, you’ll recall our journey from understanding what the SANS DShield honeypot is, to setting it up and integrating it with the SANS Internet Storm Center in the previous article.
If you missed out, don’t worry, you can catch up on the series with the links below:
🍯 Honeypots 101: A Beginner’s Guide to Honeypots
🍯 Honeypots 102: Setting up a SANS Internet Storm Center’s DShield
In this article, we’re diving into the data generated by the SANS DShield honeypot, as well as insights from other honeypots.
Our aim? To gain a better understanding of the threats and attention that a public-facing server — our honeypot — attracts. It’s a fun and educational cybersecurity project for your home lab.
To cover the basic terminology and foundational introduction, be sure to check out the first article in the series.
If you followed my previous article, ‘Honeypots 102: Setting up a SANS Internet Storm Center’s DShield,’ and have already set up a DShield Honeypot or a similar honeypot, you can follow along with this guide. If not, don’t worry! I’ve provided a detailed step-by-step guide on how to decode and analyze honeypot data.
Let’s dive in and decode the world of honeypot data together.
A Recap: Our honeypot setup
In our previous article, we successfully configured a DShield honeypot as part of the SANS Internet Storm Center project. We focused on setting up this lightweight honeypot on a very basic Linode cloud instance, running Debian 11 VPS (Virtual Private Server) with a public IP address and direct access to the Internet.
Note: Our DShield honeypot sends captured data on a regular 30-minute interval back to SANS Internet Storm Center and has been running for over 2 weeks now.
Additionally, I’ve explored setting up the DShield honeypot on a Raspberry Pi behind a home router, exposing it to the internet as a DMZ server.
While the setting up of the Raspberry Pi with the Raspian OS is widely covered in various online resources, I opted not to dive into that in my previous article, and cover the installation of the DShield agent instead.
In this instalment, irrespective of the setup you’ve chosen (RPi or cloud instance), we’ll proceed with accessing our data from the DShield honeypot project and conducting some analysis.
Analysis Using DShied Dashboards
When it comes to analyzing the data from your DShield honeypot, the first place you should visit is the SANS Internet Storm Center’s DShield Honeyboard dashboards.
One of the key benefits of using a centralized project like DShield is that it provides some basic dashboards and analytics. These dashboards offer basic analysis, making them ideal for the curious and the busy person.
Additionally, the data collected from your honeypot contributes to the wider cybersecurity community’s global threat intelligence efforts.
DShield offers some basic analysis through tables, visualizations like pie charts and line charts, and downloadable text or CSV formats of the raw logs. This level of analysis is easy to use and sufficient for most users.
If you’re a power user or someone who prefers to dive deeper into the data with custom analysis and charts, downloading the raw logs in CSV format is the way to go.
Let’s explore the main three sections (or dashboards) the DShield project has to offer in the following sections.
1. SSH/Telnet Logs
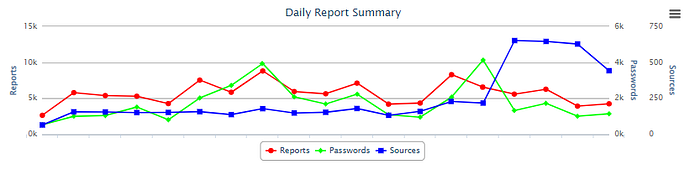
The Daily Report Summary features a line chart displaying the number of reports versus the number of attacker IP addresses over time.
This provides a quick visual summary of SSH attempts during the period you were running the DShield agent to help you spot trends over time.
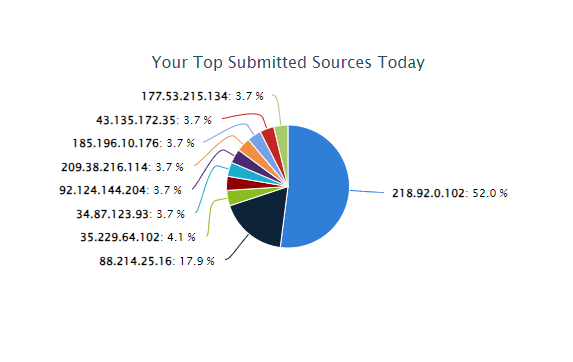
The Top Submitted Sources Today pie chart shows the top 10 SSH/Telnet attacker source IPs from today’s logs, providing a quick view of the most frequent attackers.
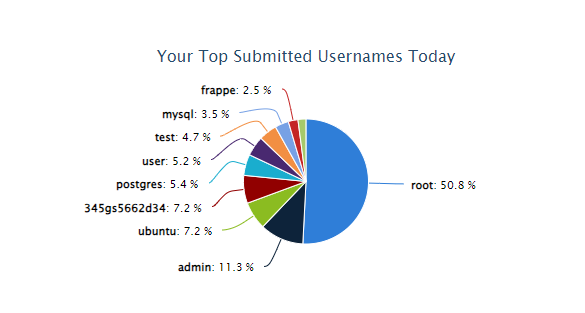
The Top Submitted Usernames Today pie chart displays the top 10 usernames attempted in today’s SSH/Telnet logs, offering a quick view of the most commonly targeted usernames.
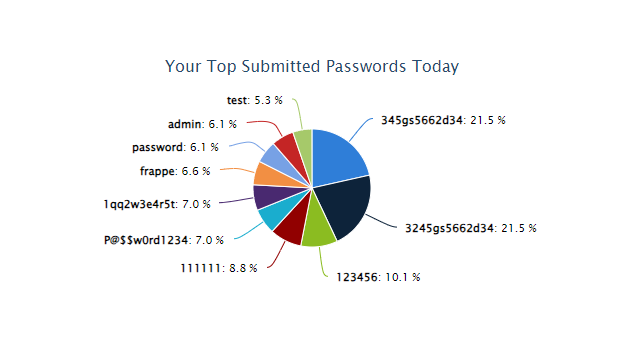
The Top Submitted Passwords Today pie chart displays the top 10 passwords attempted in today’s SSH/Telnet logs, providing a quick view of the most frequently used passwords.
2. Web Honeypot Logs

The first image is a chart showing the number of web requests for each day over a period of time. To see the exact number of attempts, simply hover over each bar.
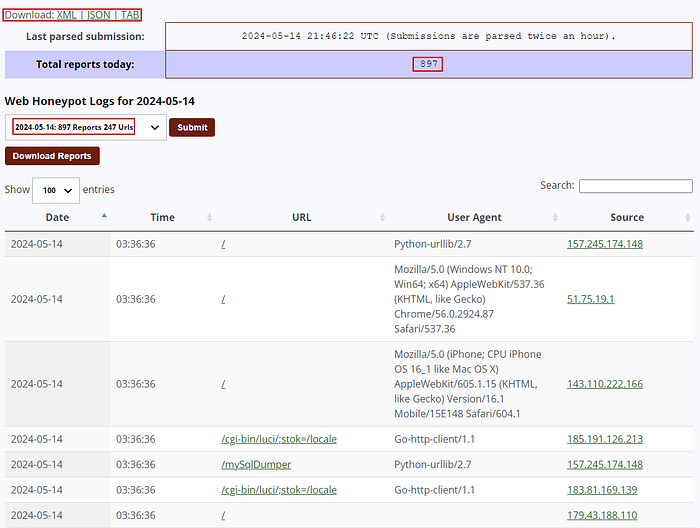
The second image shows a table with details about each request’s Date, Time, URL, User Agent and Source IP of the potential attacker.
This table is very useful as it can reveal the exact URLs requested, which can occasionally indicate a web scan for a known vulnerability, known attack patterns, or an attempt to exploit or send a payload.
The User-Agent field helps identify the source of the web request, revealing common attacker user agents, as well as requests originating from scripts, web scraping tools, or automated bots.
To browse previous days’ reports, simply select a different date from the drop-down menu.
Alternatively, you can download the full raw logs in multiple formats (JSON, XML, Tabbed).
Personally, I prefer the JSON format as it is easy to import, interpret, and manipulate with external tools, as we will see later in this article.
3. Firewall Logs

The Firewall Logs section presents you with a Firewall Log Summary bar chart graph, illustrating the number of hits against your DShield firewall over time. This graph is useful for identifying trends.
For example, if you notice a spike in hits on a specific date, you can investigate further by downloading the raw logs to understand what was happening.
Browsing the DShield Project blog may provide insights into any global threat intelligence analysis mentioning similar spikes from specific attacks or attackers.
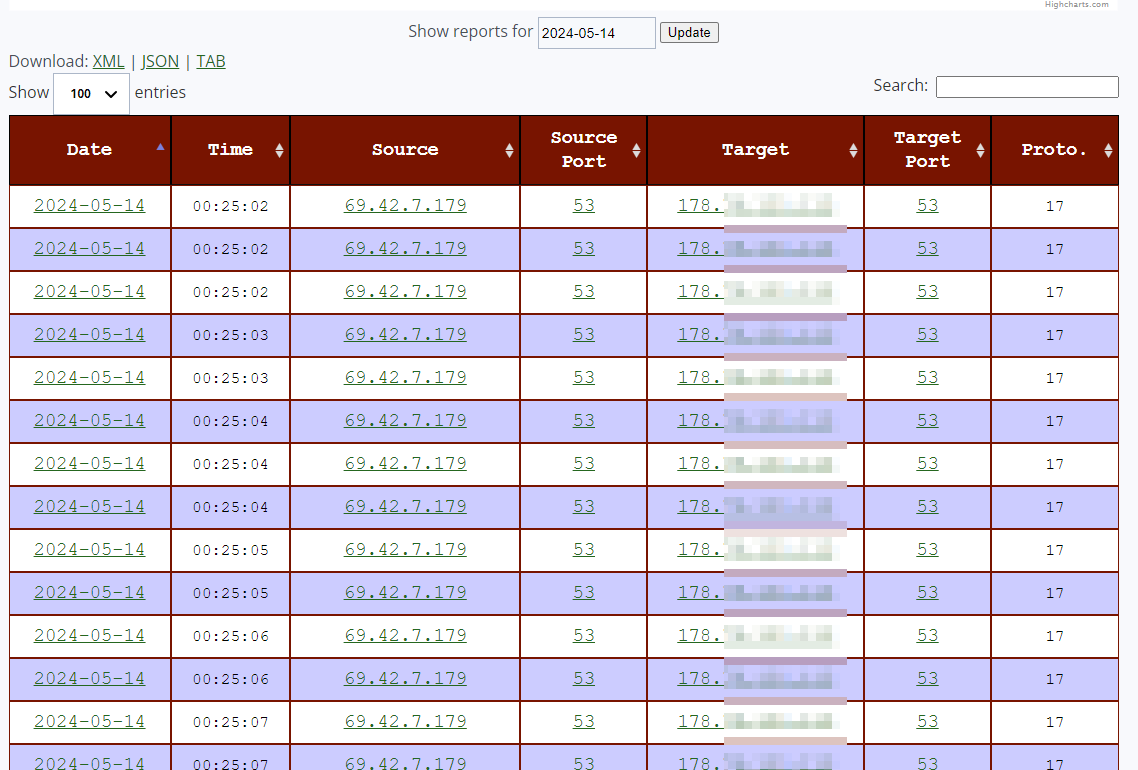
The second part of this dashboard displays a table containing standard firewall log fields: Date, Time, Source IP, Source Port, Target IP, Target Port, and Protocol Number.
Note: Protocol 17 represents UDP, while Protocol 6 represents TCP. For a reference of IANA’s assigned numbers for protocols,refer to the Protocol Numbers website.
Remember, you can change the date to review the firewall log for a specific date from the drop-down menu.
Alternatively, you can download the full raw logs in XML, JSON, or Tabbed format. My preference is JSON format for its ease of import, interpretation, and manipulation with external tools.
Analysis Using Raw Data
Ready for some hands-on analysis? Let’s roll up our sleeves and dig deeper to gain insights beyond what the DShield dashboards offer.
Whether driven by curiosity or a desire to enhance blue teaming and threat intelligence skills, this section offers a platform for cybersecurity professionals and aspiring analysts to explore.
With logs downloadable in CSV or JSON formats, analysts can format the data and leverage tools like Excel or Linux text processing utilities to gain insights, identify threats, and enhance their cybersecurity analysis skills.
Let’s dive in!
1. SSH/Telnet Log Analysis
We begin first by downloading the raw SSH reports from the DShield website to our machine, in my case a Linux VM where I will be formatting the data before importing it into Excel later.
I’ve downloaded two weeks' worth of raw SSH/Telnet logs.
$ ls -1 raw_ssh_reports*

raw_ssh_reports_2024-04-27.csv
raw_ssh_reports_2024-04-28.csv
raw_ssh_reports_2024-04-29.csv
raw_ssh_reports_2024-04-30.csv
raw_ssh_reports_2024-05-01.csv
raw_ssh_reports_2024-05-02.csv
raw_ssh_reports_2024-05-03.csv
raw_ssh_reports_2024-05-04.csv
raw_ssh_reports_2024-05-05.csv
raw_ssh_reports_2024-05-06.csv
raw_ssh_reports_2024-05-07.csv
raw_ssh_reports_2024-05-08.csv
raw_ssh_reports_2024-05-09.csv
raw_ssh_reports_2024-05-10.csv
raw_ssh_reports_2024-05-11.csv
raw_ssh_reports_2024-05-13.csv
This is what a sample of our raw log reports looks like.
$ head -n 4 raw_ssh_reports_2024-05-13.csv
id,date,time,source4,username,password
"739384000000120800","2024-05-13","00:00:02","73.62.210.252","debian","123321"
"739384000000120800","2024-05-13","00:00:59","121.202.152.120","test","admin123"
"739384000000120800","2024-05-13","00:01:21","193.201.9.156","support","support"
Let’s merge them all into one CSV file named merged_ssh.csv that we can later manipulate or load into Excel.
To avoid repeated “Header” lines we’ll need to filter them out with grep.
$ cat raw_ssh_reports_2024-04-27.csv raw_ssh_reports_2024-04-28.csv raw_ssh_reports_2024-04-29.csv raw_ssh_reports_2024-05-01.csv raw_ssh_reports_2024-05-02.csv csv raw_ssh_reports_2024-05-03.csv csv raw_ssh_reports_2024-05-04.csv csv raw_ssh_reports_2024-05-05.csv csv raw_ssh_reports_2024-05-06.csv csv raw_ssh_reports_2024-05-07.csv csv raw_ssh_reports_2024-05-08.csv csv raw_ssh_reports_2024-05-09.csv csv raw_ssh_reports_2024-05-10.csv csv raw_ssh_reports_2024-05-11.csv csv raw_ssh_reports_2024-05-13.csv | grep -v "source" >> merged_ssh.csvIn this file, we have around 68,797 source IP addresses. Some are potentially duplicated.
$ wc -l merged_ssh.csv
68797 merged_ssh.csv
It’s safe to assume some attackers may have attempted to brute force the SSH/Telnet service, thus generating multiple hits from the same source IP. Let’s find out how many unique IPs exist in the merged file.
$ cut -d "," -f4 merged_ssh.csv  | cut -d '"' -f 2 |  sort | uniq | wc -l
1520
From this outcome, we can establish that only 1520 unique attackers have generated more than 68,000+ attempts on our SSH/Telnet honeypot service.
The following command will provide us with the top 10 offending source IPs in terms of number of attempts.
$ cut -d "," -f4 merged_ssh.csv  | cut -d '"' -f 2 |   sort | uniq -c | sort -nr | head -n 10
   5990 218.92.0.103
   2685 218.92.0.102
   1098 101.34.253.39
    937 183.81.169.238
    792 161.35.146.121
    624 47.251.80.56
    550 170.64.137.171
    529 88.214.25.16
    487 193.32.162.10
    466 170.64.214.97
The first column is the count of the attempts and the second field is the source IP address.
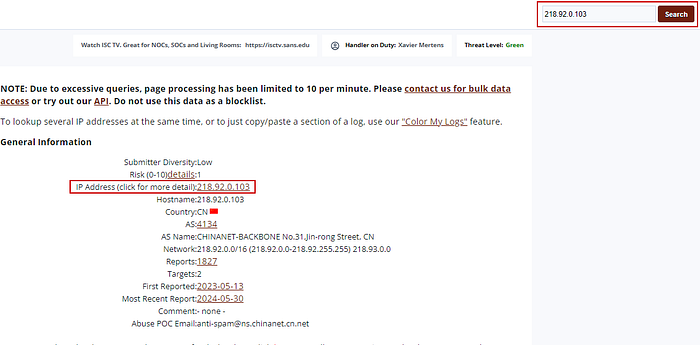
It seems as though our attacker “218.92.0.103” has targeted us more than half of the top 10 offenders put together!
DShield offers us a wider search option which provides us with information such as when this IP was first seen targeting other DShield honeypots, and their primary targets (e.g. web or SSH).
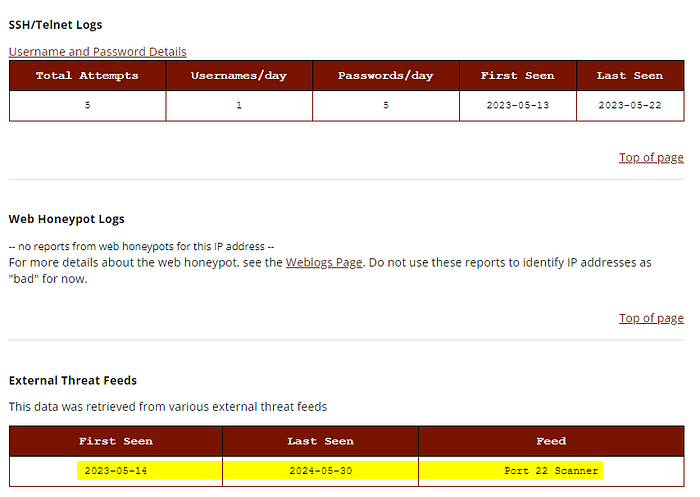
Another nifty task we can perform, either through web services or directly on the Linux host, is conducting OSINT (Open Source Intelligence) on the attackers’ IP addresses.
By gathering additional information such as the top offending Internet Service Providers (ISPs) and the country associated with the source IP address, we can enrich our charts and gain deeper insights into the origins of the attacks.
⭐️ Option 1: Using Web Services
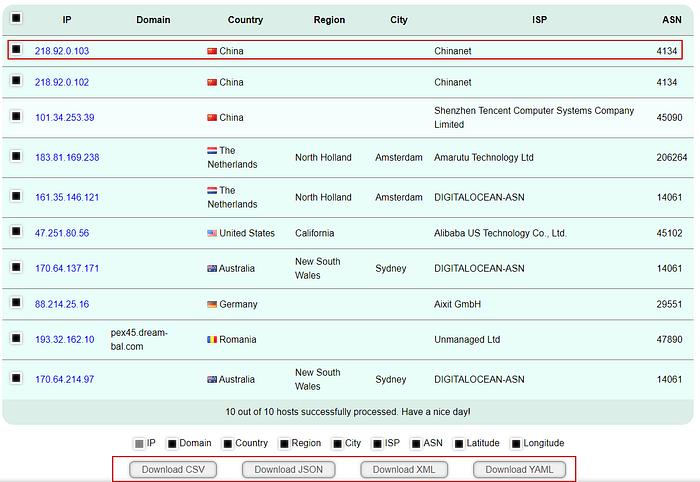
Domain and IP bulk lookup tool
This tool allows one to look up domain, location, ISP and ASN for multiple hosts (IPs or domains) at once. The limit is 100 IPs/domains per request.
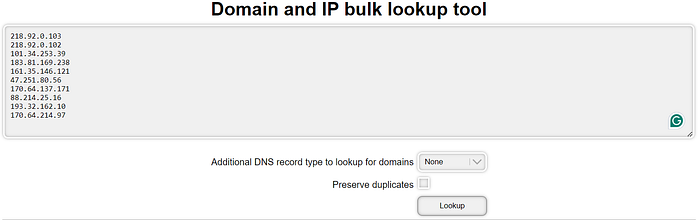
The ability to download the results in multiple formats is extremely useful. For importing to Excel we can use the CSV option.
This tool is useful for querying 100–500 IPs at a time, allowing you to split requests into batches of 100 IPs each. However, for larger volumes of IPs, managing data retrieval and merging can become tedious.
In such cases, I recommend utilizing the second tool in our arsenal, which will be covered below.
💠WhoisXMLAPI
WhoisXMLAPI is a versatile tool for in-depth analysis and OSINT, providing extensive data on IPs, domains, and more. For a free account, here are the limits for some of the services most relevant to us:
- IP Geolocation API: 1,000 free API requests per month.
- WHOIS API: 500 free API requests per month.
- DNS Lookup API: 500 free API requests per month.
The IP Geolocation API service is of particular interest for us to obtain the geolocation of our source IPs, or attackers in this case.
To make use of the API, we need to use a scripting or programming language. However, this is easily done with a simple bash or Python script.
Here’s a sample bash script to get you started. Before you use it, sign up for a free account and obtain an API key.
Replace the
API_KEYandIP_FILEvalues with your WhoisXMLAPI key and your input file, respectively.
#!/bin/bash

# WhoisXMLAPI API endpoint
API_ENDPOINT="https://ip-geolocation.whoisxmlapi.com/api/v1"

# API key (Change this)
API_KEY="Replace_With_Your_API_Key_Here"

# File containing extracted IPs  (Change this)
IP_FILE="top_1000_ips.txt"

# Loop through each IP address in the file,
# make a curl request to the API with a delay to avoid rate limiting
while IFS= read -r ip; do
    response=$(curl -s "$API_ENDPOINT?apiKey=$API_KEY&ipAddress=$ip")
    echo "$response"
    sleep 1
done < "$IP_FILE"
💡 Tip: Ensure you have removed the duplicates and don’t simply point it at an input file with more than 1,000 IPs. I made a mistake the first run using an input file with 16,000 IPs, which consisted of 80% duplicates.
Use the following commands to sort the top 1000 source IPs and remove duplicates. We’ll use merged_ssh.csv as the input file and save the results in top_1000_ips.txt.
cut -d "," -f4 merged_ssh.csv | cut -d '"' -f 2 | sort | uniq | sort -nr | head -n 1000 >> top_1000_ips.txtI’m going to test this with our top 10 source IPs from the previous exercise to see how it works. I’ve already used a large chunk of my 1000 IP Geolocation allowance, so a demo with the top 10 IPs should do. 😄
$ chmod +x ip_lookup_script.sh

$ wc -l top_10_ips.txt
10
In the snippet above, we first had to ensure the script file was executable, and that our input file contained the number of IPs we expected (max. 1000 or 10 in my first test).
Time to run our script and redirect the output to ssh_geolocation.txt.
$ ./ip_lookup_script.sh >> ssh_geolocation.txt

$ cat ssh_geolocation.txt
The results in ssh_geolocation.txtare formatted in JSON format.
{"ip":"218.92.0.103","location":{"country":"CN","region":"Jiangsu Sheng","city":"Meiyuan Xincun","lat":32.05421,"lng":118.79275,"postalCode":"","timezone":"+08:00","geonameId":8273502},"as":{"asn":4134,"name":"CHINANET-BACKBONE","route":"218.92.0.0\/16","domain":"http:\/\/en.chinatelecom.com.cn\/","type":"NSP"},"isp":"China Telecom","connectionType":"modem"}
{"ip":"218.92.0.102","location":{"country":"CN","region":"Jiangsu Sheng","city":"Meiyuan Xincun","lat":32.05421,"lng":118.79275,"postalCode":"","timezone":"+08:00","geonameId":8273502},"as":{"asn":4134,"name":"CHINANET-BACKBONE","route":"218.92.0.0\/16","domain":"http:\/\/en.chinatelecom.com.cn\/","type":"NSP"},"isp":"China Telecom","connectionType":"modem"}
{"ip":"101.34.253.39","location":{"country":"CN","region":"Beijing Shi","city":"FengSheng","lat":39.91857,"lng":116.37092,"postalCode":"","timezone":"+08:00","geonameId":1899233},"domains":["zaixianpeixun.com"],"as":{"asn":45090,"name":"TENCENT-NET-AP","route":"101.34.192.0\/18","domain":"","type":"Content"},"isp":"Tencent-CN","connectionType":""}
{"ip":"183.81.169.238","location":{"country":"HK","region":"Southern","city":"Aberdeen","lat":22.24802,"lng":114.15289,"postalCode":"","timezone":"+08:00","geonameId":1819757},"as":{"asn":206264,"name":"AMARUTU-TECHNOLOGY","route":"183.81.169.0\/24","domain":"https:\/\/koddos.net","type":"NSP"},"isp":"","connectionType":""}
{"ip":"161.35.146.121","location":{"country":"US","region":"Massachusetts","city":"Westford Station","lat":42.59704,"lng":-71.43534,"postalCode":"","timezone":"-04:00","geonameId":4955225},"as":{"asn":14061,"name":"DIGITALOCEAN-ASN","route":"161.35.144.0\/20","domain":"https:\/\/www.digitalocean.com","type":"Content"},"isp":"DigitalOcean","connectionType":""}
{"ip":"47.251.80.56","location":{"country":"US","region":"California","city":"Baywood Park","lat":37.52993,"lng":-122.34564,"postalCode":"","timezone":"-07:00","geonameId":7176004},"domains":["commercial-equips.com"],"as":{"asn":45102,"name":"ALIBABA-CN-NET","route":"47.251.0.0\/17","domain":"http:\/\/alibabagroup.com\/","type":"Content"},"isp":"Alibaba","connectionType":""}
{"ip":"170.64.137.171","location":{"country":"US","region":"Illinois","city":"Lincolnshire","lat":42.19002,"lng":-87.9084,"postalCode":"60069","timezone":"-05:00","geonameId":4899983},"as":{"asn":14061,"name":"DIGITALOCEAN-ASN","route":"170.64.128.0\/19","domain":"https:\/\/www.digitalocean.com","type":"Content"},"isp":"DigitalOcean","connectionType":""}
{"ip":"88.214.25.16","location":{"country":"DE","region":"Hessen","city":"Altstadt","lat":50.11029,"lng":8.68255,"postalCode":"","timezone":"+02:00","geonameId":7118103},"as":{"asn":29551,"name":"HGCOMP-ASN","route":"88.214.25.0\/24","domain":"https:\/\/www.aixit.com","type":"NSP"},"isp":"Aixit GmbH","connectionType":"modem"}
{"ip":"193.32.162.10","location":{"country":"GB","region":"England","city":"Whitton","lat":51.44941,"lng":-0.35688,"postalCode":"","timezone":"+01:00","geonameId":2634004},"as":{"asn":47890,"name":"UNMANAGED-DEDICATED-SERVERS","route":"193.32.162.0\/24","domain":"","type":""},"isp":"","connectionType":""}
{"ip":"170.64.214.97","location":{"country":"US","region":"Illinois","city":"Lincolnshire","lat":42.19002,"lng":-87.9084,"postalCode":"60069","timezone":"-05:00","geonameId":4899983},"isp":"","connectionType":""}
If you want to go the extra mile and extract only the IP, Country, and ISP and convert the JSON data to CSV formatted data ready to be imported to Excel, you can use the jqutility, a command-line JSON processor.
$ jq -r '. | [.ip, .location.country, .isp] | @csv' ssh_geolocation.txt | tr -d '"'

218.92.0.103,CN,China Telecom
218.92.0.102,CN,China Telecom
101.34.253.39,CN,Tencent-CN
183.81.169.238,HK,
161.35.146.121,US,DigitalOcean
47.251.80.56,US,Alibaba
170.64.137.171,US,DigitalOcean
88.214.25.16,DE,Aixit GmbH
193.32.162.10,GB,
170.64.214.97,US,
⭐️ Option 2: Linux IP Geolocation Utilities
The geoiplookup tool is a handy command-line utility used to quickly obtain geolocation information about IP addresses.
It’s particularly useful when you’ve reached lookup limits on free online services or prefer performing lookups directly on your Linux host.
$ while read -r ip; do echo "$ip: $(geoiplookup "$ip")"; done < top_10_ips.txt

218.92.0.103: GeoIP Country Edition: CN, China
218.92.0.102: GeoIP Country Edition: CN, China
101.34.253.39: GeoIP Country Edition: CN, China
183.81.169.238: GeoIP Country Edition: NL, Netherlands
161.35.146.121: GeoIP Country Edition: NL, Netherlands
47.251.80.56: GeoIP Country Edition: US, United States
170.64.137.171: GeoIP Country Edition: AU, Australia
88.214.25.16: GeoIP Country Edition: DE, Germany
193.32.162.10: GeoIP Country Edition: RO, Romania
170.64.214.97: GeoIP Country Edition: AU, Australia
Now that we’ve explored two methods of performing analysis: web services and command-line, let’s dive into how to make sense of the data using spreadsheets with our trusty Excel.
📊 Excel Analysis
While processing large amounts of text on our Linux host is invaluable for tasks like searching, sorting, and removing duplicates, it’s time to elevate our analysis by importing our reports into Excel.
With Excel’s visual capabilities, we can create charts that offer a more intuitive and insightful representation of our data.
Without having to dive into tedious details of how to import and format the data in Excel, let’s summarise the steps I have taken so far:
- Downloaded full raw logs for SSH/Telet brute-forcing attempts.
- Run geolocation queries on the IP addresses to enrich our data.
- Import into Excel from CSV formatted files.
- Create Pivot Tables and Charts and filter them for Top 10.
✴️ ️️Top 10 Usernames
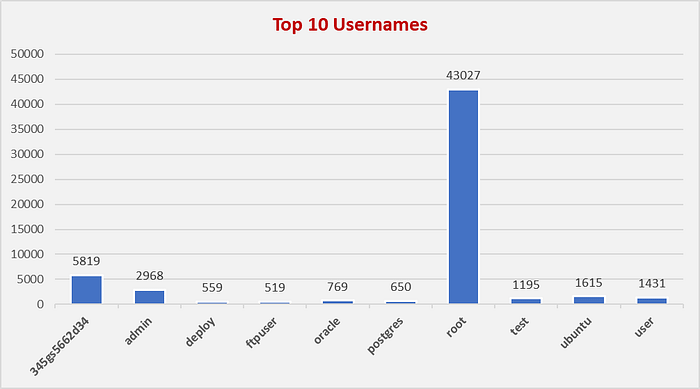
From this chart, we can observe that the user “root” is still the king when it comes to SSH and Telnet brute force attempts.
- 345gs5662d34: Seemed like a randomly generated or compromised username at first, not typical for legitimate SSH access. Further research (see below) suggests it is used by IoT devices.
- admin: Common administrative account with elevated privileges, often targeted by attackers.
- deploy: User account typically used for deployment automation tools, often has access to deployment scripts.
- ftpuser: Standard user for FTP services, might have limited permissions and is a frequent target for brute force attacks.
- oracle: Default user for Oracle database installations, often has significant access within the database environment.
- postgres: Default user for PostgreSQL databases, usually has full administrative rights to the database system.
- root: The superuser account with full administrative privileges, a prime target for attackers.
- test: Generic user account often used for testing purposes, may have varying levels of access.
- ubuntu: Default user account on some Ubuntu installations, typically has sudo access.
- user: Generic account name, often seen in default setups or scripts, may have basic or elevated permissions.
The username “345gs5662d34” stands out as unusual. It appears to be randomly generated, likely a signature for a backdoor or compromised system used by certain attackers or botnets. Unlike common software-created usernames, this one isn’t typically targeted in brute force attacks, suggesting it changes slightly and is recognized by specific attackers, as seen in SANS honeypot data.
UPDATE: According to both SANS and TEHTRIS global honeypots, the username and or password 345gs5662d34 (and its variant 3245gs5662d34) account for roughly 30% of brute force attempts on SSH against their honeypot sensors.
Further research suggests that SSH attempts using the password ‘345gs5662d34’ may be due to it being the default credential for a Polycom CX600 IP telephone, according to a research paper by Aalport University in Denmark.
✴️ Top 10 Passwords
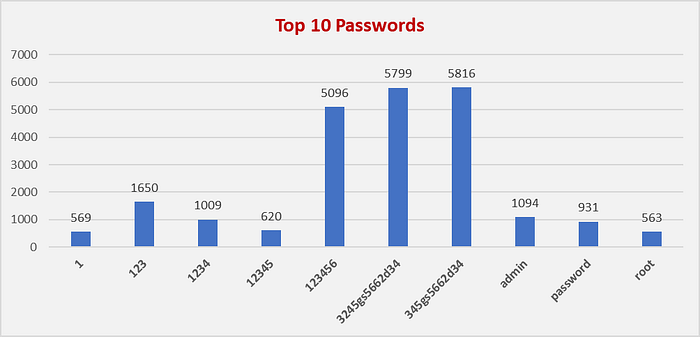
The Top 10 SSH passwords captured by the honeypot reveal a clear pattern of weak, easily guessable passwords. The sequence “1, 123, 1234, 12345, 123456” highlights attackers’ preference for simplicity and low-hanging fruits.
The standout passwords, “3245gs5662d34” and “345gs5662d34,” link directly to the unusual username “345gs5662d34” we previously discussed, suggesting a targeted backdoor or compromised system signature used by specific attackers or botnets.
Common entries like “admin,” “password,” and “root” further highlight the persistent use of default and administrative credentials in brute force attacks, mirroring the top usernames.
This data emphasizes the critical need for strong, unique passwords to protect against unauthorized access.
✴️ Brute-force Attempts By Date
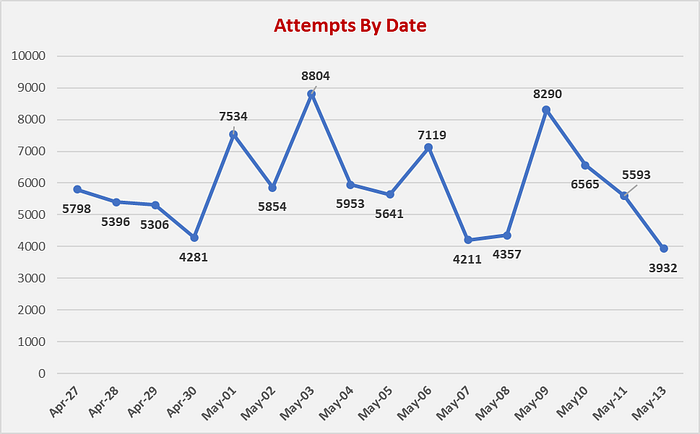
This data highlights the erratic nature of brute force attacks, with attackers ramping up their efforts sporadically. The fluctuations suggest that while some days experience a lull, others see a sharp rise in malicious activity, likely driven by botnets or coordinated attack campaigns.
These patterns can inform defensive strategies, underscoring the need for consistent vigilance and adaptive security measures.
It’s useful to investigate certain sudden or sharp spikes and correlate them with data from SANS DShield blog and other honeypot findings. They could be linked to known attacks in the wild as part of a campaign.
✴️ Top Source IP Internet Service Providers (ISP)
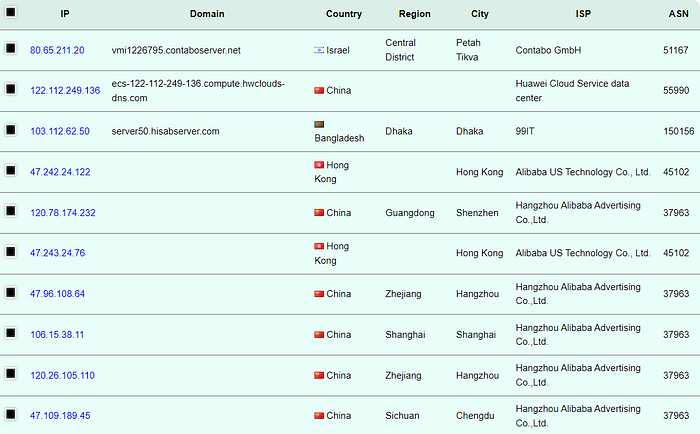
China, including Hong Kong ISPs owned by China, accounted for 80% of the top 10 attack sources. Even when considering logs from a two-week period, they are likely to continue dominating the top spot.
This leads me to believe that targets in the West or the US are more susceptible to scans or attacks from virtual machines and cloud instances hosted in mainland China, Hong Kong, or other regions where Chinese ISPs operate.
2. Web Logs Analysis
We kick off our analysis by downloading daily Web Reports from the desired timeframe as CSV files.

$ ls -1
404reports_2024-04-27.csv
404reports_2024-04-28.csv
404reports_2024-04-29.csv
404reports_2024-04-30.csv
404reports_2024-05-01.csv
404reports_2024-05-02.csv
404reports_2024-05-03.csv
404reports_2024-05-04.csv
404reports_2024-05-05.csv
404reports_2024-05-06.csv
404reports_2024-05-07.csv
404reports_2024-05-08.csv
404reports_2024-05-09.csv
404reports_2024-05-10.csv
404reports_2024-05-11.csv
404reports_2024-05-12.csv
404reports_2024-05-13.csv
See below a sample of some reports to understand the format.
$ head -n 3 404reports_2024-04-27.csv 404reports_2024-05-01.csv 404reports_2024-05-12.csv
==> 404reports_2024-04-27.csv <==
date,time,url,user_agent,source
"2024-04-27","11:16:31","/","Mozilla/5.0 (Windows NT 10.0; Win64; x64) AppleWebKit/537.36 (KHTML, like Gecko) Chrome/56.0.2924.87 Safari/537.36","51.75.19.1"
"2024-04-27","11:16:31","/","Mozilla/5.0 (iPhone; CPU iPhone OS 16_1 like Mac OS X) AppleWebKit/605.1.15 (KHTML, like Gecko) Version/16.1 Mobile/15E148 Safari/604.1","143.110.222.166"

==> 404reports_2024-05-01.csv <==
date,time,url,user_agent,source
"2024-05-01","11:16:28","/","Mozilla/5.0 (Windows NT 10.0; Win64; x64) AppleWebKit/537.36 (KHTML, like Gecko) Chrome/56.0.2924.87 Safari/537.36","51.75.19.1"
"2024-05-01","11:16:28","/","Mozilla/5.0 (iPhone; CPU iPhone OS 16_1 like Mac OS X) AppleWebKit/605.1.15 (KHTML, like Gecko) Version/16.1 Mobile/15E148 Safari/604.1","143.110.222.166"

==> 404reports_2024-05-12.csv <==
date,time,url,user_agent,source
"2024-05-12","03:36:32","/","Mozilla/5.0 (Windows NT 10.0; Win64; x64) AppleWebKit/537.36 (KHTML, like Gecko) Chrome/56.0.2924.87 Safari/537.36","51.75.19.1"
"2024-05-12","03:36:32","/","Mozilla/5.0 (iPhone; CPU iPhone OS 16_1 like Mac OS X) AppleWebKit/605.1.15 (KHTML, like Gecko) Version/16.1 Mobile/15E148 Safari/604.1","143.110.222.166"
Merge all the reports into a single file named web_reports.csv.
$ cat  404reports_2024-04-27.csv 404reports_2024-04-28.csv 404reports_2024-04-29.csv 404reports_2024-04-30.csv 404reports_2024-05-01.csv 404reports_2024-05-02.csv 404reports_2024-05-03.csv 404reports_2024-05-04.csv 404reports_2024-05-05.csv 404reports_2024-05-06.csv 404reports_2024-05-07.csv 404reports_2024-05-08.csv 404reports_2024-05-09.csv 404reports_2024-05-10.csv 404reports_2024-05-11.csv 404reports_2024-05-12.csv 404reports_2024-05-13.csv >> web_reports.csv

$ wc -l web_reports.csv
11909 web_reports.csv
After importing the CSV reports into Excel (remember to remove duplicate headers), we should see something like the below image.
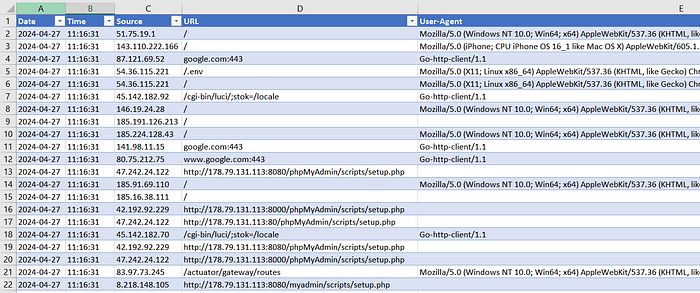
By creating some Pivot tables we can generate some meaningful charts.
✴️ Web Attempts By Date
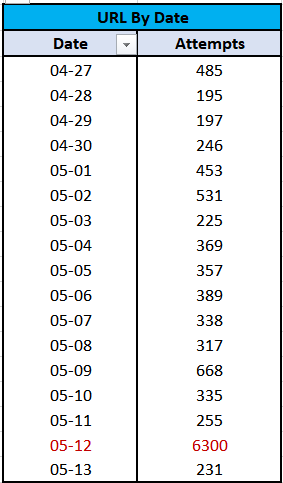
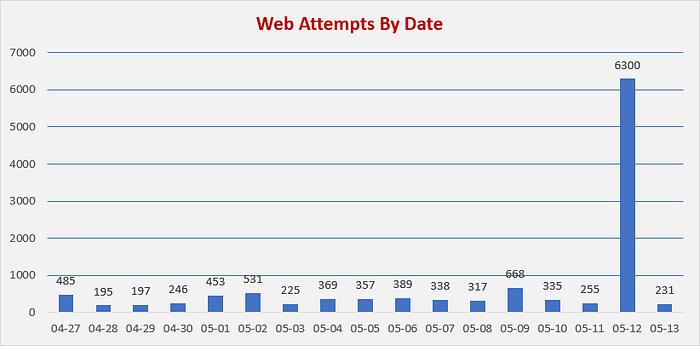
May 12th stands out as exceptionally active for our Web honeypot, with 6300 hits compared to the daily average of 350. Let’s dig in to uncover why.
✴️ Top 10 Attack Source IPs
Which IP is the top attacker responsible for the spike?
$ cat 404reports_2024-05-12.csv | cut -d "," -f 6 | tr -d '"' | sort | uniq -c | sort -nr | head -n 1
   5913 80.65.211.20
The Pivot table confirms our attacker 80.65.211.20 is responsible for 82% of the hits on our Web honeypot.
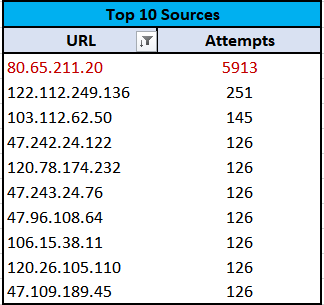
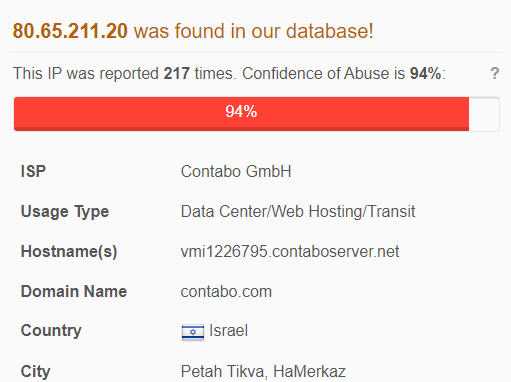
Performing basic OSINT on this IP address revealed the following:
- 80.65.211.20 [vmi1226795.contaboserver.net]
Contabo Server is a German Virtual Private Server (VPS) provider. However, this specific host is based in Israel.
DShield Project’s global honeypot data reveals that this IP has been known for a while to be an attacker IP which solely focuses on probing HTTP, HTTPS and Apache web servers.
VirusTotal reported some red flags about this IP address.
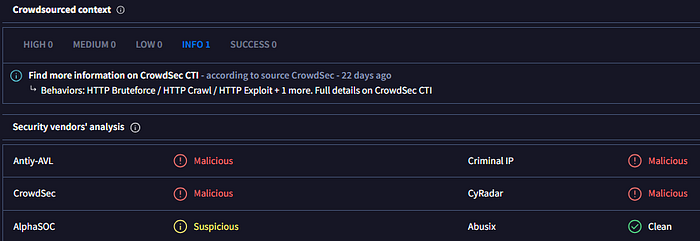
AbuseIPDB had this IP flagged for abuse with a high confidence of 94%.
✴️ Top 10 URLs Requested
Curious to know what the top 10 URL requests sent to our honeypot were?

Here’s a quick breakdown of the URLs:
- “/”: The root directory of a website, commonly targeted for general scanning or exploration. It is the most frequently targeted path to check if a web server is active on the port.
- “/.env”: A file often used to store sensitive configuration information. Attackers may attempt to access it for potential vulnerabilities or data exposure.
- “/cgi-bin/luci/;stok=/locale”: A potential indicator of attempted scanning and exploitation of vulnerable TP-Link devices. This likely relates to CVE-2023–1389, a known command injection vulnerability in TP-Link Archer routers. The scan uses a specific path to access a configuration interface.
- “/favicon.ico”: The favicon file. Its frequent access might indicate scanning for website fingerprinting.
- “/robots.txt”: Accessing this file could reveal information about the website’s structure or sensitive areas.
- “/sitemap.xml”: An XML file that lists the URLs for a website. Accessing it could provide insight into the structure and content of the website.
- “/wp-content/themes/twentytwentyone/readme.txt”: A readme file for the well-known Twenty Twenty-One WordPress theme, which has known vulnerabilities. Attackers access it to gather theme version details and exploit potential weaknesses.
- “google.com:443”: Atackers are likely testing if our server is misconfigured to allow open HTTP proxying or to exploit potential vulnerabilities in how the server handles external requests.
- “api.ipify.org”: Ipify provides the public IP address of the requester. ShadowServer scanners used this URL to test for open HTTP proxies, both with and without authentication, as part of their effort to identify and report accessible proxies for legitimate and abusive uses.
- “www.shadowserver.org:443”: Access attempts by Shadowserver, a non-profit cybersecurity organization. They conduct daily scans of the entire IPv4 Internet and operate large-scale sensor networks. The resolved IPs confirm these scans were part of Shadowserver’s global data collection efforts.
✴️ Top 10 User-Agents Used
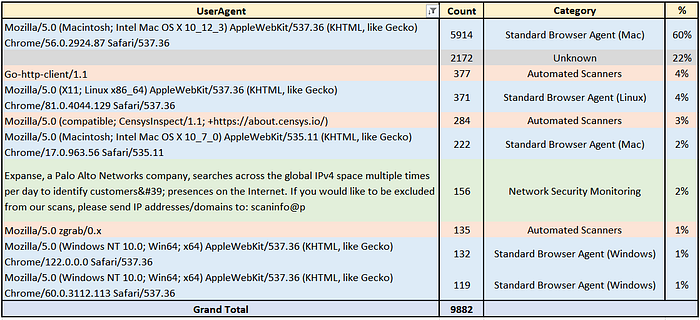
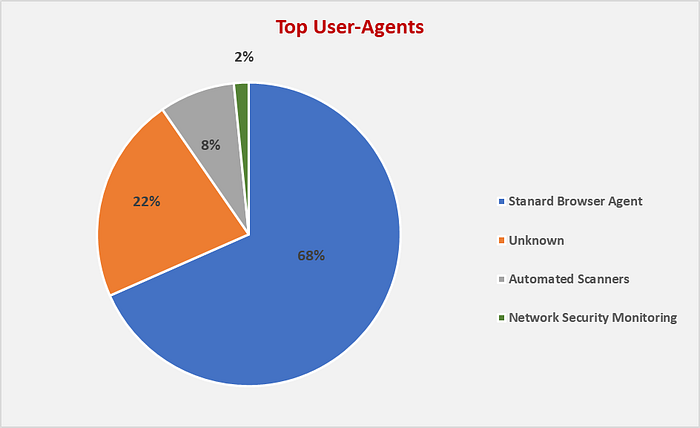
User-Agent can be blank in HTTP requests. Attackers might do this to avoid detection or obscure their identity. Legitimate requests can also have blank User-Agent headers due to misconfigurations or specific software behaviors. I’ve listed those under the “Unknown” category.
Some User-Agents under the category of “Network Security Monitoring”, belonged to legitimate security vendors scanning and monitoring the winder Internet.
In the category of “Automated Scanners”, the “go-client” user-agent is commonly used by applications and scripts written in the Go programming language.
These automated and programmed probes can originate from either legitimate security monitoring tools or from attackers. Therefore, it’s crucial to further investigate the source IPs to determine their true nature.
One final note: the “Standard Browser Agent” is typically associated with browsers on desktop or mobile devices. However, it’s important to keep one warning in mind.
Considering attackers’ capability to mimic any user-agent, it’s wise to take user agents with a grain of salt in cybersecurity analysis.
Observations
In our analysis of the honeypot data, we’ve identified several noteworthy patterns and observations.
- Legitimate Scans
Many scans originate from legitimate security vendors conducting comprehensive internet-wide sweeps. These vendors often possess unique fingerprints, allowing for easy identification and potential whitelist inclusion in your Intrusion Detection System (IDS), should you choose to do so. - Seasonal Trends
We noticed spikes in certain scans or from specific IP ranges during seasonal campaigns. Understanding these patterns can provide valuable insights into the timing and nature of potential threats. - User Agent Blocking
To mitigate risks, many services employ measures to block commonly abused user agents such as ‘curl’ or ‘pylib.’ These proactive measures help to deter malicious activity and safeguard systems. However, they are not bulletproof as attackers can spoof normal browser user-agents. - Offender-friendly ISPs
Not all Internet Service Providers (ISPs) treat abusive behavior equally. Some ISPs exhibit more tolerance towards such activity than others, highlighting the importance of monitoring and assessing the behavior of various network providers. The majority of offending ISPs seem to be concentrated in China. This is possibly due to our honeypot being based on a US data centre. IPs originating from Alibaba cloud services and Tencent were the most notable. - HTTP Proxy Testing
Attackers frequently test for open HTTP proxies that they can exploit for various purposes. This testing allows them to assess if a server can be leveraged to relay traffic, mask their identity, or bypass security restrictions.
Conclusion
If you’ve made it all the way through this guide (no peeking at the conclusion — just kidding), hats off to you!
Setting up your own honeypot and digging into its data is quite the journey.
Throughout this guide, we’ve dived into formatting and analyzing data from the DShield Project’s honeypot, a key component of the SANS Internet Storm Center’s global network.
Using a humble Linode VPS running Debian Linux, we’ve captured Firewall, Web, and SSH/Telnet logs with our DShield Honeypot client.
In the vast wild west that is the Internet, it’s important to remember that those automated scans come from a variety of sources — security vendors like Censys and Shodan, and even security researchers doing their global exploration.
Given this, it’s smart not to jump the gun and blacklist every captured IP. False positives can happen, accidentally blocking legitimate sources.
Instead, take the time for a thorough investigation, maybe even report suspicious activity to the right folks.
Getting into threat intelligence (TI) and open-source intelligence (OSINT) is a very neat exercise to acquire or improve cybersecurity skills.
Platforms like VirusTotal, Abuse IP DB, and other IP information and reputation sites offer some useful insights.
Don’t forget to check out the DShield website! It might reveal if those suspicious IPs have been spotted elsewhere on SANS Internet Storm Center.
With this newfound knowledge, you’re ready to dive deeper into investigating and responding to threat intel data — a journey of constant learning and proactive cybersecurity defense.
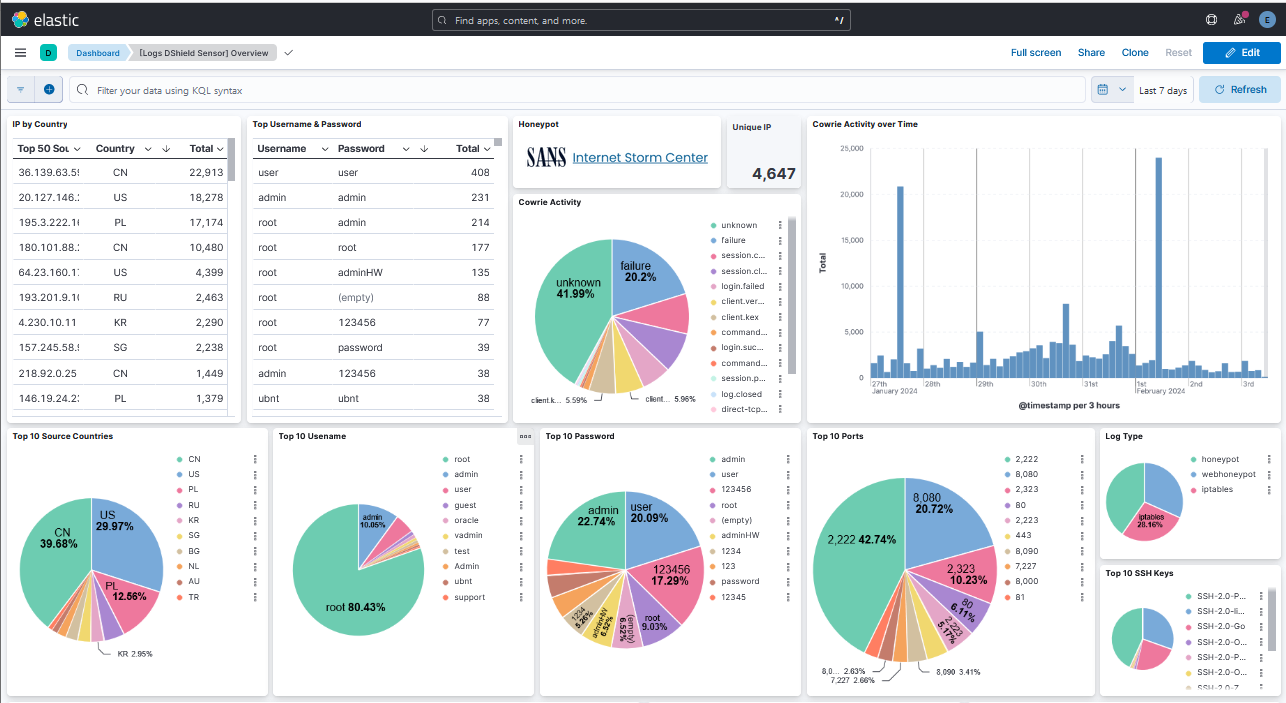
Why stop there? Take it a step further by setting up a SIEM like Elasticsearch and forwarding all honeypot logs to it. This allows for deeper analysis, alerting, and reporting on the threats detected by the honeypot.
Stay tuned for a follow-up article covering a more advanced honeypot (T-Pot) with greater capabilities. I hope you continue following along on this journey of exploring honeypots! 🍯
👇 Next in the series:
Further Reading
- Honeypots 101: A Beginner’s Guide to Honeypots 🍯
- Honeypots 102: Setting up a SANS DShield Honeypot 🍯
- Honeypots 104: T-Pot — Your All-in-One Honeypot Platform Guide 🍯
- A Guide To Securing Your Remote Access Using SSH Keys 🔐
- TryHackMe: Introduction to Honeypots
- DShield Sensor Project
- Installing the DShield Honeypot on a Raspberry Pi
- DShield Sensor Log Collection with Elasticsearch
Thank you for your interest and for visiting my blog!
As I continue my honeypot project, I look forward to sharing my experiences and insights with you.
Now, Go and Play!